Metamodel + peakCSE#
This page describes the Metamodel + peakCSE EOS parametrization and its implementation in jester.
It is closely related to the Metamodel + CSE model but uses a physically motivated functional
form for the high-density speed of sound rather than a free piecewise interpolation.
Physical motivation#
The plain CSE extension places no constraints on the shape of \(c_s^2(n)\) above the break density and requires many parameters when a fine density grid is needed. The peakCSE model of [1] imposes more structure by combining two physically motivated components: a logistic function that drives the speed of sound smoothly toward the conformal limit \(c_s^2 = 1/3\) expected from perturbative QCD at asymptotically high densities, and a Gaussian peak that captures a possible phase transition — where matter briefly stiffens before settling toward the conformal limit.
Speed-of-sound parametrization#
While this model was introduced in [1], here we use the implementation and notation from [2]. Above the break density \(n_\mathrm{break}\), the squared speed of sound is parametrized as follows:
where \(\xi\) is a constant offset chosen at construction time to ensure continuity of \(c_s^2\) at \(n_\mathrm{break}\). The logistic term drives \(c_s^2 \to 1/3\) at large densities regardless of the other parameters, while the Gaussian term is a transient feature that can represent a rapid stiffening associated with a phase transition.
The full EOS above \(n_\mathrm{break}\) is then obtained by integrating the same thermodynamic relations as in the CSE model (see Metamodel + CSE for similar equations and more information):
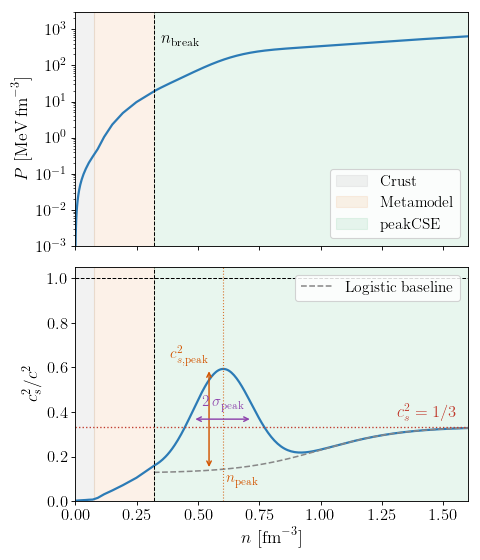
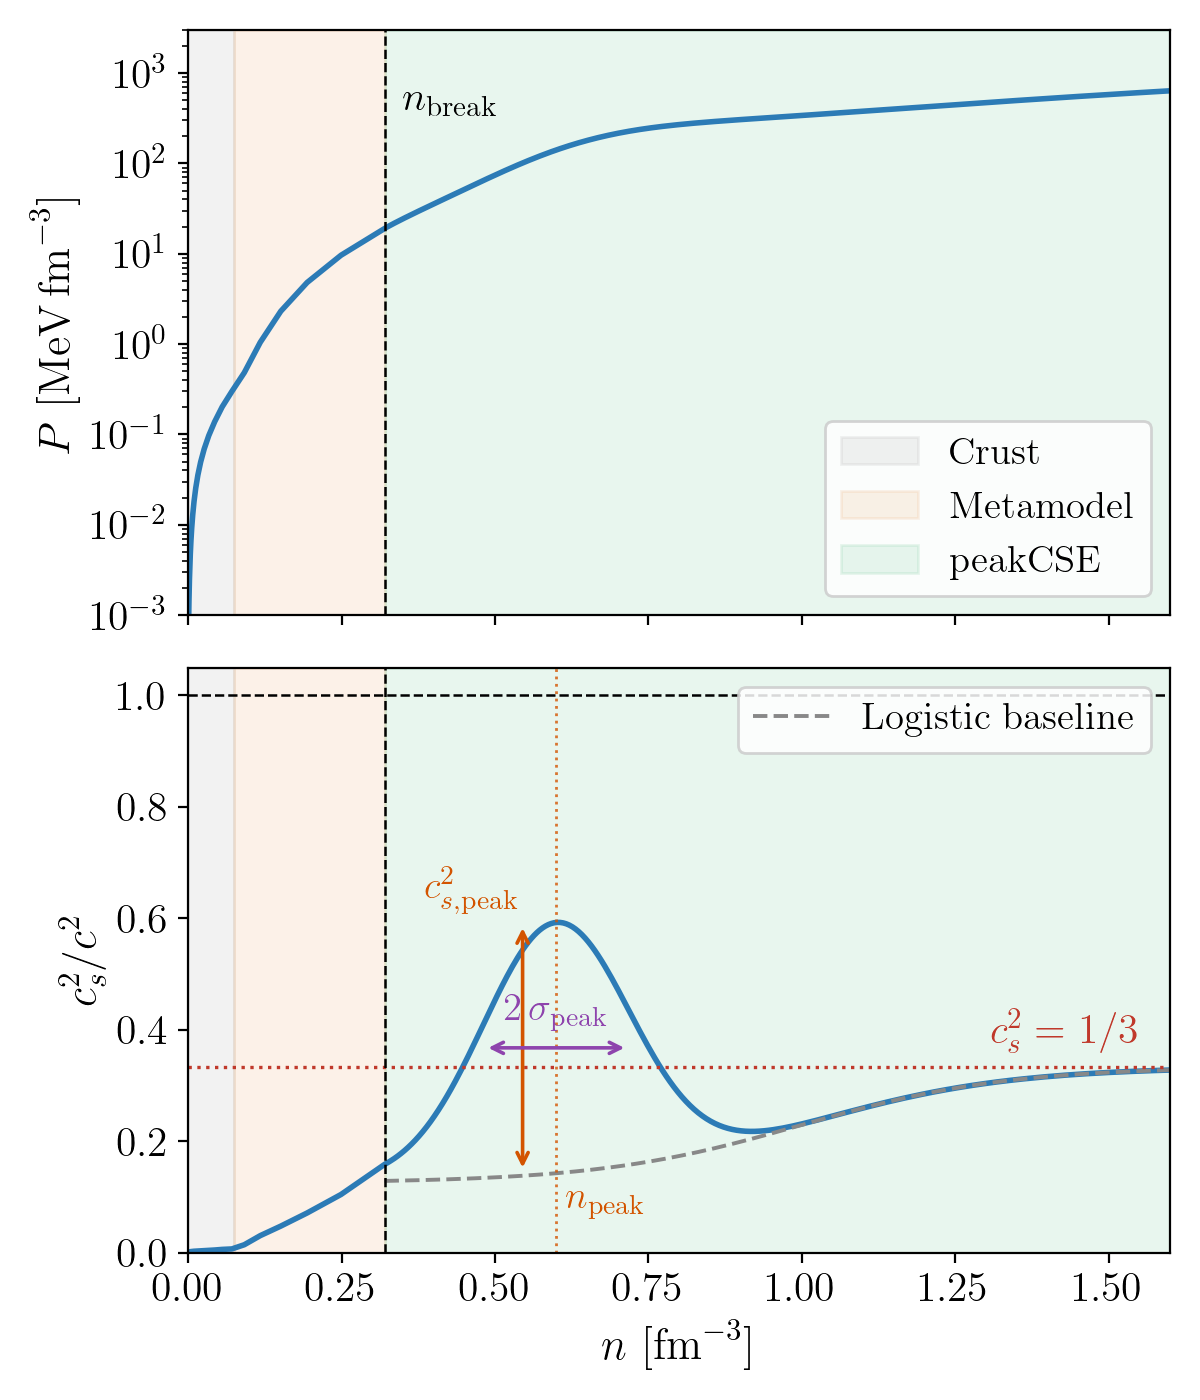
The example below shows the pressure and speed of sound for a representative EOS with the peakCSE extension starting at \(n_\mathrm{break} = 2\,n_\mathrm{sat}\).
(Source code, png, hires.png, pdf)

Pressure (top) and squared speed of sound (bottom) versus baryon number density for a representative Metamodel + peakCSE EOS. The grey, orange, and green shaded bands indicate the crust, the metamodel core, and the peakCSE extension region, respectively. The dashed grey curve in the lower panel is the logistic baseline (the Gaussian term removed), showing how \(c_s^2\) settles smoothly toward the conformal limit \(c_s^2 = 1/3\) (dotted red line). Annotations mark the Gaussian peak amplitude \(c_{s,\mathrm{peak}}^2\), its central density \(n_\mathrm{peak}\), and the one-sigma half-width \(\sigma_\mathrm{peak}\).#
Parameters#
The peakCSE model adds 5 parameters on top of the 9 NEPs and the \(n_{\rm{break}}\) density:
gaussian_peak(\(c_{s,\mathrm{peak}}^2\)) — amplitude of the Gaussian peak in \(c_s^2/c^2\).gaussian_mu(\(n_\mathrm{peak}\)) — central density of the peak in \(\mathrm{fm}^{-3}\).gaussian_sigma(\(\sigma_\mathrm{peak}\)) — width of the peak in \(\mathrm{fm}^{-3}\).logit_growth_rate(\(l_\mathrm{sig}\)) — rate at which the logistic term rises.logit_midpoint(\(n_\mathrm{sig}\)) — density at which the logistic term reaches half its asymptotic value.
In total the model has \(9 + 1 + 5 = 15\) free parameters.
Usage example#
Configuration file:
eos:
  type: metamodel_peakcse
  ndat_metamodel: 100
  nmax_nsat: 12.0
  crust_name: DH
Prior file (excerpt):
nbreak         = UniformPrior(0.16, 0.48, parameter_names=["nbreak"])
gaussian_peak  = UniformPrior(0.0, 1.0,   parameter_names=["gaussian_peak"])
gaussian_mu    = UniformPrior(0.3, 1.5,   parameter_names=["gaussian_mu"])
gaussian_sigma = UniformPrior(0.05, 0.5,  parameter_names=["gaussian_sigma"])
logit_growth_rate = UniformPrior(1.0, 20.0, parameter_names=["logit_growth_rate"])
logit_midpoint    = UniformPrior(0.5, 2.0,  parameter_names=["logit_midpoint"])
Further resources#
API reference:
jesterTOV.eos.metamodel.MetaModel_with_peakCSE_EOS_modelCSE background: Metamodel + CSE
References
S. K. Greif, G. Raaijmakers, K. Hebeler, A. Schwenk, and A. L. Watts. Equation of state sensitivities when inferring neutron star and dense matter properties. Mon. Not. Roy. Astron. Soc., 485(4):5363–5376, 2019. arXiv:1812.08188, doi:10.1093/mnras/stz654.
Peter T. H. Pang, Stephanie M. Brown, Thibeau Wouters, and Chris Van Den Broeck. Revealing tensions in neutron star observations with pressure anisotropy. Phys. Rev. D, 113(6):063047, 2026. arXiv:2507.13039, doi:10.1103/6qc8-3k97.